Download
ParabolicM.mq4
الأحد، نوفمبر 22، 2009
PriceTrender MT4 Indicator
the indicator used to check the price location instead of moving average. price tender is fully adjustable so u can change price, period, moving average type and timeframe.
Download
PriceTrender.mq4
Priliv_s MT4 Indicator
The indicator represents 3 lines of different colors showing the trend speed on the current, the nearest larger and the next larger timeframe (TF).
Beige line means calculations with the smallest period (current TF).
Green line represents the nearest larger TF in the current TF.
Red line is used to represent the trend in the next larger TF. It can be applied to any timeframes.
Inflection of the indicator means that the trend direction has changed.
Download
Priliv_s.mq4
QQE (Qualitative Quantitative Estimation) MT4 Indicator
QQE is a combination moving average RSI + ATR. It's very useful for volatile pair such as GBP/ JPY , GBP/USD , USD/ JPY.
Recent Strength MT4 Indicator


More Information about Recent Strength indicator and how to use it HERE
Download
Recent Strength.ex4
Reversal Indicator Priliv
The indicator displays four lines of different colors.
The white line (displayed with black color on the picture) is the ?? with the period of 8, it is used just for demonstrativeness, displaying some average line of the trend.
The next three lines show the speed of the trend on the current, closest larger and the next larger timeframe.
The first line (color "Wheat") designates the calculation of the speed, based on the MA with the least period, and displays the rate of change of the trend on the current timeframe.
The second line (color "DarkSeaGreen") is used to display on the current timeframe the rate of change of the trend in the closest larger timeframe.
The third line (color "DarkSalmon") is used to display the tendency in the next larger timeframe.
The bend of the indicator designates the change of the trend direction. It can be applied to any timeframe.
Download
Priliv.mq4
S-RoC MT4 Indicator
This indicator is described in the book by Alexander Elder "How to play and win at the stock exchange. First, compute the exponential moving average of closing prices (EMA), then determined the rate of change (RoC).
Input parameters:
MA_Period - period EMA, the default 13;
ROC_Period - the rate of change, the default is 21.
Although the author recommended the use of options 13/21 (for medium-and long-term trading in the stock market), yet it is desirable to demonstrate how to optimize for the short-term periods.
Simple (unsmoothed) ROC:
If you want to use this indicator as a simple (unsmoothed) RoC, simply install MA_Period equal to 1.
Trading Strategy:
* If the indicator is below the zero line, is set up from the trough - buy.
* If the indicator, while above the zero line, turns down from the peak - to sell.
* Divergence (divergence) between the values of the oscillator and the price gives a particularly significant sign, play in the direction of the indicator.
Download
S-RoC.mq4
SDX-TzPivots MT4 Indicator
 Calculation of pivot and similar levels based on time zones.
Download
SDX-TzPivots.mq4
Safe Zone MT4 Indicator
SafeZone measures market noise and places stops at a multiple of noise level away from the market.
Download
SafeZone_v0[1].1.mq4
Scalper Cannel MaksiGen MT4 Indicator
go sell when the price break the bottom line and buy when the price break the top line
Download
ScalperCannel_MaksiGen.mq4
Schaff Trend CD MT4 Indicator
The Schaff Trend CD (STCD) identifies repeated high and low patterns, or cycles, within a MACD measure of trend. STCD does this by comparing trend to a moving average of itself. The input for the STCD is the difference between two exponential moving averages (a MACD Line). The resulting oscillator measures when trend is accelerating or decelerating, showing a trend cycle.
Download
Schaff Trend CD.mq4
Spearman's Rank Correlation MT4 Indicator
Spearman's Rank Correlation is a non-parametric method used in order to make statistical studies of relationship between variables. In this case, the factual degree of parallelism between two numeric sequences will be detected.
The practical calculation of Spearman's Rank Correlation includes the following stages:
1) pair each indication with its number (rank) and rank them from the highest to the lowest or vice versa;
2) subtract the two sets of ranks of each pair of values to be compared;
3) square each difference and add the obtained values;
4) calculate the rank correlation from the following formula:
where  is the sum of squares of rank differences,
  is the number of paired observations.
When employing the rank correlation, one conditionally estimates the correlation ratio between indications considering the values being equal to or below 0.3 to be the indications of low correlation ratio, whereas the values between 0.4 and 0.7 are considered to indicate a moderate correlation ratio, values above 0.7 - to indicate a high correlation ratio.
Spearman's Rank Correlation is a little less powerful than the Parametric Correlation.
It is reasonable to use the rank correlation when there is just a small amount of observations. This method can be used for both numerical data and in the cases, when the registered values are detected by attributes of various intensity.
Download
SpearmanRankCorr.mq4
Stochastic Color v1[1].02 classic MT4 Indicator
It is a great indicator you can trade using this indicator only
Download
Stochastic Color v1[1].02 classic.mq4
Stochastic Histrogram MT4 Indicator
A indicator which shows the overbought/oversold status of the market.. Use default settings of 14,3,3 .
Buy when the price crosses to positive. Sell when the price crosses down to negative. Green histogram means it's in an uptrend. Red histogram means it's in a downtrend.
Download
StochHistogram.mq4
T3 Moving Average MT4 Indicator
The T3 Moving Average was described by Tim Tillson in the January 1998 issue of Technical Analysis of Stocks & Commodities article "Smoothing Techniques for More Accurate Signals". The T3 is a significant improvement over traditional moving averages; it's smoother with much less lag. However, it can "overshoot" price as it attempts to re-align itself with current market prices.
The T3 Moving Average can be used in place of traditional moving averages. Please refer to the "Moving Average" indicator for additional details.
Download
T3MA.mq4
T3 TRIX MT4 Indicator
Interpretation of the generator Trixie is very simple, when rates rise the generator, we must buy, and sell when the generator is falling. To obtain the smoothed generator Trixie, often use moving averages.
Download
T3 TRIX.mq4
Tim Morris MA (MMA) MT4 Indicator
Created by Tim Morris in 29th May 2004 (version 2).
Converted for MT4 by Nikolay Kositsin in 2005.
Authors' comments:
"use short duration bars e.g. 5min set length to give required speed of response increase damping to eliminate overshooting Lower length will require Higher damping".
Settings:
Length = 10;//inverse of driving coefficient
damping = 5;//smoothing (percent)
maxgap = 30;//maximum week gap ignored (pips)
Shift = 0;
CountBars = 300;//drawn per call - tune this to avoid
Trend Envelopes_v1 MT4 Indicator
This indicator indicates to the trend direction.
Download
Trend Envelopes_v1.mq4
Volatility Quality MT4 Indicator
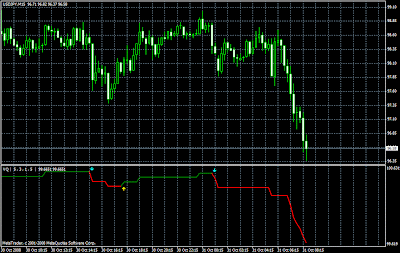
 Volatility Quality Index that permits to find the main trends. The buy/sell signals are indicated by arrows and the up/down trends by green/red lines.
Download
Volatility Quality.mq4


