الخميس، نوفمبر 19، 2009

Heiken Ashi MT4 Indicator

There are five primary signals that identify trends and buying opportunities:
- Hollow candles with no lower "shadows" indicate a strong uptrend: let your profits ride!
- Hollow candles signify an uptrend: you might want to add to your long position, and exit short positions.
- One candle with a small body surrounded by upper and lower shadows indicates a trend change: risk-loving traders might buy or sell here, while others will wait for confirmation before going short or long.
- Filled candles indicate a downtrend: you might want to add to your short position, and exit long positions.
- Filled candles with no higher shadows identify a strong downtrend: stay short until there's a change in trend.
These signals show that locating trends or opportunities becomes a lot easier with this system. The trends are not interrupted by false signals as often, and are thus more easily spotted. Furthermore, opportunities to buy during times of consolidation are also apparent
Source

Download
Heiken_Ashi_Ma.mq4

Hi-Lo MT4 Indicator


Download
Hi-Lo.mq4

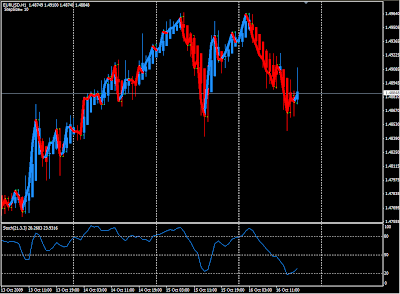
Hist_StepMA_Stoch_KV1_Ex_03 MT4 Indicator

Download
Hist_StepMA_Stoch_KV1_Ex_03.mq4

Horizontal Lines Breakout MT4 Indicator

It is a Multi-Time frame Indicator
It will only use the latest last 3 candlestick on the chart. By comparing between the 1st & 2nd candlestick, whichever candlestick has the highest point = HI , lowest point = LO. Then it will draw a horizontal line for the HI & LOW with a color orange. Then it will also draw another horizontal line for both HI & LOW with +/- 15 pips in lime color.
Download
Filter AO.mq4

IN10TION NewsReader v09.97 lite News MT4 Indicator and Template


New NewsReader

Just follow the instructions provided by the indicator. ( message box )
Install as an indicator, this is not an EA.
please. allow DLL imports on your custom indicator/Common tab

# IN10TION NewsReader v09.97 new updated: 06 Sept. 2009
AUTO FOREX NEWS UPDATING
- new column/setting layout fixes (color news aligning)
- added CNY (China) news in standard settings
# auto updates: every 30 minutes! When there is news it will update every 30 seconds till it retrieves the news actual value.
# change News.Set either to 1 or 2
# change Main.Anchor.Show from false to true, it will display the anchor (red 2 cubes left top), double click-hold & drag it to the place you want to have your IN10TION NewsReader v09


Download
IN10TION NewsReader v09.97 lite.rar

IShark MT4 Indicator

It is good for knowing overbought and oversold and i think in 30Mins Time frame will give good results.

Download
IShark_v1.mq4

Instant TrendLine MT4 Indicator

Download
Instant TrendLine.mq4

JB Center of Gravity MT4 Indicator

Download
JB Center of Gravity.mq4

JE-Bar Trend MT4 Indicator


Download
JE-Bar Trend.mq4

Jaimo JMA MT4 Indicator

This indicator comprises two moving averages. These moving averages are much more sophisticated and smoothed than the normal MAs. They filter much of the noise and do not oscillate abruptly in times of consolidation as the standard ones. The JMAs would not make you open and close negative positions on every bar when sideways market appears, thus taking back all the profits you made in the previous trend. On the contrary, they would filter much of the false movements.
The faster JMA's offset will let you stay in the trend and the specific movement if several fake consolidation bars appear, thus not making you to exit prematurely.
This indicator is close to perfection and gives excellent results on its own.

Download
Jaimo-JMA.mq4

JoGET MT4 Indicator

Download
+JoGET#58+.mq4

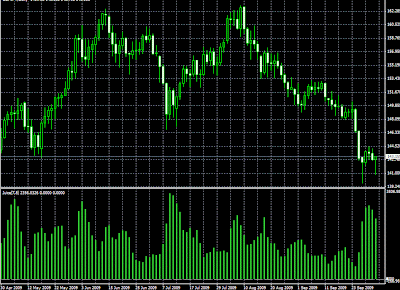
Juice Levels Alert New MT4 Indicator


Download
JuiceLevelsAlertNew.mq4

Keltner Channels MT4 Indicator

The Keltner Channel indicator locates the most important trends. The indicator is based on principles similar to those used in Envelopes and Bollinger Bands. The difference is in that instead of percentage (Envelopes) or standard deviations (Bollinger Bands),

the average true range is used here. The upper band is calculated as the moving average plus the average, for N periods, true range.
The lower band is the moving average minus the average true range.
As a rule, the upper band detects that the market is overbought and that correction will most probably be down-directed.
The lower band means that the market is oversold and that correction will most probably be up-directed.

Download
Keltner_Channels.mq4

LSwpr_in+Color MT4 Indicator


Green go buy, Red go sell and yellow do not trade (stay away)
Download
LSwpr_in+Color.mq4

LWMA Crossover Signal MT4 Indicator


Download
LWMA Crossover Signal.mq4

THUNDER4WD MT4 Expert Advisor

Before you open the program MetaTrader4, make sure to save the file you downloaded


As an example I will use MT4 Alpari-UK.


Files that you download consists of 3 folders (EA, Indicator, templates)


1. Open the EA folder and copy all the files in the folder and then paste C:\ProgramFiles\MetaTrader - Alpari-UK\experts


2. Open the Indicators folder and copy all the files in the folder and then paste C:\ProgramFiles\MetaTrader- Alpari UK\experts\indicators


3. Open the Template folder and copy all the files in the folder and then paste C:\ProgramFiles\MetaTrader- Alpari UK\templates


Now you can open the program MetaTrader4, Open EURGBP chart and select TimeFrame M5 and then switch the template by clicking Charts\Template\!_rdb_THUNDER4WD_v2a templates.


You will see charts like this picture:


after you activate the template "!_rdb_THUNDER4WD_v2a” templates in the chart, that means you have a complete EA and the indicators are required by EA on the chart.


Now, we need to activate the EA in the charts.


Right-click select Expert Advisor Propertis click (or press the F7).


after you choose the Properties or pressing the button F7


The image will appear


Clik “OK” and the EA is ready to do Automated Trade for you.


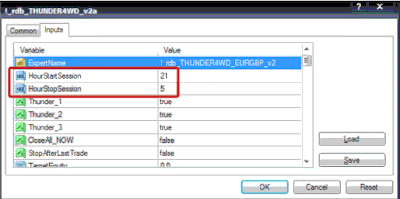
Another thing that needs to be is setting in the EA, you need to change the settings are:


- HourStartSession = 21 (default)


- HourStopSession = 5 (default)


This related to the clock / timer broker, the broker note on the hour charts, no matter where you are now and what time you are in, because these settings are not related to the local time but the time to read the broker on MT4.


EA will only make trading in the range of time OpenHour - CloseHour


- Risk = 20 (default)


Risk set the number of the Lot will be opened by EA using the LotsOptimized Setting TRUE with calculations AccountFreeMargin / Risk / MaxTrades.


If you want the EA open fixed Lot, please change LotsOptimized Setting FALSE then change Lots = 0.1 to the number you want lot amount open by EA


The base system used by EA is looking for the sideway conditions around at Asian Session with small TakeProfit 5-9 Pips and Stoploss 28-32 Pips


During you want to use this EA, the computer must be online and MT4 connected either with your broker.


Spread of your broker is another vital setting for scalper strategy. Do not use scalper strategy on brokers with spread = 5 or more. For scalper strategy allowed spread size is 2-4 only.


Default setting MaxSpread=3.5 and The EA will not Open any Posision if Spread more than MaxSpread


Back Test report form 1/1/2005 to 1/1/2008 it converted 10000$ to 246188$


Download


Back Test report


THUNDER4WD_v2е.rar

PipsMania V2.0 Forex Expert Advisor

PipsMania V2.0 is the most sophisticated multi-timeframe Expert Advisor "EA" to hit the Forex trading community! This Robot scans 8 seperate timeframes from 1 Month down to 1 Minute automatically and simultaneously. 99.9% no loss is obtained when no type of stop loss is employed. We are averaging approximately 550 pips per week.
PipsMania 2.0 Features
* Automatically searches for counter trends between the monthly and 5 minute timeframes.
* HAS self moving average variables fully modifiable.
* Self checking logic.
* Optional enter on a fresh signal when EA is first turned on (switchable).
* Money management available.
* Take profit with fixed pip amounts that you decide for each timeframe.
* Take profit can be set for each individual timeframe.
* All TP and SL are adjustable.
* Partial close option to take 1/2 profit automatically when TP is reached.
* Stop loss can be set at a fixed pip amount.
* Trailing stop loss feature is available.
* Trailing stop trigger and pip step amount fully adjustable.
* Trading hours only available to trade based on your times you choose.
* Ability to take 1/2 profit when TP target is triggered and let other half run up.
* The robot has the ability to place hedge trades automatically.
* New feature that places a seperate trade in the direction of the counter trend. This means additional trades and more profit.
* The EA can trade any pair you wish but major currency pair is recommended.
* Using MetaTrader 4
* Easy to use and setup

Website: http://pipsmaniav2.blogspot.com

Martingail Breakdowning_v1 MT4 Expert Advisor

Expert applying capital management method of Martingale.

Particularly experts - increases the loss-making arm, considering that the price will continue its movement, and not vice versa bounce off the level, ie the breakdown option. Much more stable and more stable than all other options.

Just a few comments:
* Parameter LogariphmicMM (when the MM) includes manimenedzhment when increasing the lot size of the deposit increases, but at a slower rate than the deposit, ie, the load on the deposit decreases. We must decide only Riskfactor;
* Parameter ProfitPercent defines the required size of our profit as a percentage of the depot. Since the series does not close at all levels and they can be separated by 200 points. However, if enabled OptimalTakeProfit, the size of the required profit increases by the square root of the maximum open lot. OptimalTakeProfit recommended.
* For those who want to try adviser on a real account, be sure to include Close_on_TP, then the series closes on TakeProfit and stop-loss. There, like all properly considered and bidam, and ASCAME ... If this option is off, the warrant simply closed to achieve the necessary profit;
* The selection of parameters: the euro is better to move about 20, ProfitPercent about 0,3-0,5. The taste and color. Per pound of step 30.
* Profitnost increases with decreasing step and the risk too;
* The initial orders are opened in both sides of the lot size is 0.1. They need only to reference the initial level.
Topic is discussed in detail in http://forum.alpari-idc.ru/thread24642.html.

New version. Added mode lights out (in contrast to the breakdown, when the ratio of equity / balance is less than 0.7), trailing stop is a profitable position. Podrdobno code is commented. Options well suited for a pound - Step 20, TrailingStop 30, ProfitPercent 0.5.
Download
Martingail Breakdowning_v1.mq4

Frank ud MT4 Expert Advisor


ONE OF THE MOST PROFITABLE, STABLE AND EASY automated trading systems for FOREX TO DATE!
Has a stable profit, the unique algorithm of the first transaction and the system output Losev transactions bezubytok by Martingale. The system is uniquely flexible and profitable - a stable profit from 500% in less than 1 year - checked. A little fear can only recoil at the price jumps of 2000 or more points "in the wrong direction, what happens during the economic collapse of any country, war, major terrorist attacks, etc. This happens once in 2 years. This can be seen on TV and in advance to suspend work on the adviser to a week or less.
Specifications:
* Algorithm MM: Martingale in the breakdown.
* Terminal: Metatrader 4
* Sovetuemye tools: any.
* Settings: SET files prilagayutsya for example.
* Period: from M5 up to D1
* Minimum depot: for every 10 000 is required lot 0,01 (secure option)
for every 1000 requires lot 0,01 (risky setting)
* Performance: From 500% per year. depends on the shoulder, the level and frequency of lots reinvestment.
* DC: Anyone with a micro 0.01 Lot, Mini 0.1 unit, or common account 1 lot.
* Opening hours: around the clock on weekdays.
* Internet: need a stable without a glitch.
* Reinvestment: Yes.
Principle:
Open positions up and down.
Waiting movement.
- Top up against the movement of Martingale (eg 0,01, 0,02, 0,03, etc..) Closes: Rollback. Take Profit.
- The movement: Minimum lot. (Eg 0,01) Closes: take profit.
Be sure to spend optimization. Counselor is very sensitive to the settings.
Attention is a martingale, it contradicts one of the rules of trade, not work against the trend! Budtte with caution!
Download
Frank ud.mq4

Firebird MT4 Expert Advisor

Works best on the USDJPY only!!! on a M30 timeframe.
500 PIPS average a week on this one from other sites......forward tested....
Firebird calculates a 10 day SMA and then shifts it up and down based on a percentage to form a channel.
For the calculation of this SMA either close (more trades) or H+L (safer trades) is used.
When the price breaks a band a postion in the opposite of the current trend is taken. If the position goes against us we simply open an extra position to average (pipstep function).
To avoid enter a trade while a strong trend is in place a divergence function is used that is calculated as difference between a Faster SMA (by default set to 23) and a Slower SMA (by default set to 84).
Download All Versions of Firebird
Firebird63G.mq4
Firebird v63H02
FirebirdSafe
Firebird v63G Magic
Firebird v3.2
Firebird v065tf
Firebird v3.2 (5 digits)

Enterra Forex Star MT4 Expert Advisor

Professional MTS (Trade Robot) from an international software company! Starting with version 3.1. available for purchase by all comers. Start trading with a real system and proven effectiveness.
Proven profitability. Stable growth of the deposit. Is absolutely automatic. Full support is guaranteed by the manufacturer.
New Enterra Forex Star EA is able to take all of your Forex trading and fully automate the extraction of profit from your account even when you sleep. A revolutionary solution for you Enterry perform analysis, comparison, decision-making on purchases or sales, opening and closing transactions for the continuous increase your deposit.
Look at the Onix-trade statistics on the actual accounts managed Enterra Forex Star EA:
Use the login: 12361, password: strelec1, server: real.ristoncapital.com: 443 for access to the account actually running under the Enterra Forex Star EA!
Main advantages:
• Multicurrency - successfully trades on the EURGBP, EURCHF, GBPCHF, USDCAD, EURCAD, USDCHF, CADCHF. (Improved!)
• Fully automatic - until it sells, you relax!
• The size of the deposit does not matter.
• Flexible customization of the level of risk and the size of used capital.
• Factor profitability - 2,7 - 3,3.
• We provide the source code to the program (All guarantees!).
• Help the development team to set and change settings.
• Guaranteed manufacturer's technical support.
• Timely updates for licensed copies.
• Ability to adapt for your requirements and strategy (under custom development).
• And much more ...
Enterra Forex Star EA

Labels: MT4 Expert Advisor

at 3:40 PM

5 comments:

Thanks for the post..
I got some useful information from this post
You should write more about this
I'll be waiting for your next post
Good Day!!
Cynthia Tanady
Online Trading Now

Hello! Please note 3.1 version is not on sale now but new 3.5 version is available.
And don't hesitate to contact me for more details at ea@enterra-inc.com.
Have a good trade.

Hello.
Please be advised the 3.1 version is not on sale now.
But you can get the 3.5 for free!
Enterra is proud to announce the releases of Enterra Forex Star EA 3.5. The improved version is currently available and has improved features to increase your trading profits.
Version 3.5 trades with less drawdown and less risk. In contrast to 3.1 that would opening up to 2 orders in the same direction for the same pair 3.5 version uses improved algorithm that will not allow you to have 2 unprofitable orders for the same pair (although the client can let the EA open double orders to his own discretion using the appropriate rule in the EA parameters). Thanks to better technological forecasting the version 3.5 can increase profits over the previous version.
We've also extended the number of primary signals for the entrance - for 30-50%.
Additionally we have implemented some useful functionality to extend safety in our new version 3.5:
- closing the orders with small profit/loss at the end of the EA trading session to minimize the risk of losses on the orders opened out of the EA trading time;
- new parameters for trading timeout (prohibit trading in the most volatile portion of the trading session);
- closing the order after quick sudden movement to the "right" direction;
- the drawdown control (the number of point to be taken will be reduced if the price goes the "wrong" direction).
We have also included the number of features at the request of our clients:
- the autolot is settled according to the risk size in percents to the deposit for each of the orders, this means if you've settled the risk of 10% you won't lose more than 10% of your deposit in case of unsuccessful order closing;
- indication of the EA work on the chart - now you always clearly see that the EA is launched and it's the trading time now.
Get more info - http://www.enterra-inc.com/forex-partners/special-offers.html.
The version for Dukascopy is also available for free! - http://www.enterra-inc.com/enterra-ea-35-dukascopy.html.
Wish you good trade.

Anonymous said...

Hi! I have been using this EA for 6 months already. And can say it's rather stable. Not every month I can have 50-80% but every month I'm in profit anyway. The summer was very slow trading, september and october is trading perfectly!
I recommend you try at least. The test is free. This is worth trading!

talina said...

Well. The ForexPeaceArmy uses this EA for public test for 5 months and says it's really stable in its results. http://www.forexpeacearmy.com/metatrader_expert_advisor/enterra_forex_star/demo
They seems to use minimal risk settings.

Volatility-based currency trading

Market volatility can be a complex subject, but understanding a few basic principles can help you implement strategies to capitalize on volatility extremes.

Volatility-based trading approaches have traditionally been popular among hedge funds, commodity trading advisors, and other professional traders. There are many ways to gauge volatility and incorporate it in a trading strategy. Of the different ways to characterize and trade volatility, the best are based on the tendency of volatility to “revert to the mean.”
The premise behind volatility mean reversion is that periods of extraordinarily high volatility should be followed by periods of lower, more normalized volatility. Similarly, periods of extraordinary low volatility should be followed by periods of higher, more normalized volatility. This tendency is reflected by the familiar progression of a market that meanders in a narrow trading range (a low-volatility condition), only to explode out of the consolidation and embark on a strong price trend (a highvolatility condition). Eventually, the price move exhausts itself, at which point volatility will again fall to a lower level.
We’ll analyze the two simple methods for trading volatility in the forex market: inside days and shortterm/ long-term volatility comparisons.
Consecutive inside bars
An inside bar is a bar whose range is contained within the prior bar’s range — that is, the bar’s high and low do not exceed the previous bar’s high and low (see Figure 1). They are easy to identify visually and should be one of the basic patterns traders should notice immediately.
Inside bars by definition have lower volatility — that is, less price movement — than their preceding bars, and successive inside bars reflect progressively shrinking volatility. Per the mean-reversion theory, the more inside bars, the higher likelihood of a volatility surge or a breakout scenario.
The following volatility trade can be implemented after at least two consecutive inside bars have formed. This type of strategy is best employed on daily charts; the longer the time frame, the more significant the potential breakout.
The strategy works for both longs or shorts. Although entry orders can be placed on both sides of the market, traders should use other tools to determine the bias for a particular trade. For example, if the inside days occur within a bullish chart pattern, such as a developing ascending triangle, this increases the likelihood of an upside breakout. On the other hand, if the inside days are developing within a descending triangle formation, this increases the likelihood of a downside breakout. Here are the rules for a long trade setup:
1. Buy above the high of the most recent inside bar.
2. Place a stop-and-reverse (SAR) order a few pips (approximately 5 to 10 pips, depending on the bid-ask spread) below the low of the most recent inside bar. The purpose of the SAR order is to reverse the position if the initial move turns out to be a false breakout.
3. If the position moves higher by the risk amount (the difference between the entry price and the stop price), sell half the position and replace the SAR order with a trailing stop.
4. If the SAR order is triggered after the entry, place a stop a few pips above the high of the most recent inside bar.
Short trades: For a short trade, the rules are the same except that you enter below the low of the most recent inside day and place an SAR order a few pips above the high of the most recent inside day.
Figure 2 shows two consecutive inside bars in the U.S. dollar/Canadian dollar (USD/CAD) rate. Applying the strategy, a buy order is placed above the high of the most recent inside bar, while a stop is placed below the low of the most recent inside bar. The long order is triggered and a 200-pip rally ensues with virtually no retracement.
Figure 3 shows a more complex trade example in which the SAR order is triggered. Because of the bullish implications of the ascending triangle that was forming when the two inside bars appeared, the long-trade entry rules were executed:
1. We placed an order to go long a few pips above the high (.7660) of the most recent inside day. The order was triggered.
2. We placed an SAR order a few pips below the low of the most recent inside day at .7600 for a risk of approximately 60 pips. The SAR was triggered when the market broke out of the bottom of the triangle, and we sold the original long position and entered into a new short position.
3. When the market moved lower by the risk amount (60 pips), we sold half the position (at .7540). We then used a 30-pip trailing stop on the remaining position.
The low on April 14, 2004 was .7299, and we exited the remaining half of the position at .7329.
Volatility comparison
Currency option volatilities measure the rate and magnitude of the past and potential future changes in a currency’s price, and they can be a useful tool for timing currency movements.
Implied option volatilities, which are reflected in option premiums, are the market’s current estimate of the future fluctuation of a currency’s price. Historical (or statistical) volatility, which reflects past price movement, is typically measured by calculating the annualized standard deviation of price changes over a given period (e.g., 20 days, 100 days).
Figure 4 shows only current option implied volatilities (which are based upon a survey of interbank sources). Traders implementing this strategy would need to keep a journal tracking historical implied volatilities. Onemonth and three-month implied volatilities are two of the most commonly benchmarked time frames.
When option volatilities are low, traders should look for potential breakouts. Current implied volatility should be at least 25 percent lower than historical implied volatility. (It is best to measure against actual historical volatility, but that data is not always readily available.) Conversely, when option volatilities are high, traders should look for range trading opportunities.
Typically, when a currency trades in a range, its option volatility will decline, because by definition range trading means lack of movement.
When option volatilities make a pronounced down move, it is usually a sign of a significant potential price move and upcoming trade opportunity.
This characteristic is very important for both range and breakout traders.
Traders who usually sell at the tops of ranges and buy at the bottoms can use this approach to predict when their strategy could potentially stop working, because if volatility becomes very low, the likelihood of continued range trading decreases.
On the other hand, breakout traders can monitor option volatilities to make sure that they are not buying or selling into false breakouts. If volatility is at average levels, the likelihood of a false breakout increases. Alternatively, if volatility is very low, the probability of a real breakout is higher. However, traders must be careful because volatilities can have long downward trends, as they did between June and October 2002. Therefore, declining volatilities can sometimes be misleading. What traders need to look for is a sharp move in volatility, rather than a gradual one.
Figure 5 shows an example in the U.S. dollar/Swiss franc rate (USD/CHF). The blue line is price, the green line is the one-month (or shortterm) volatility, and the red line is three-month (or longer-term) volatility. For most of December 2003 the onemonth volatility was below the threemonth volatility, which coincided with the development of sharp down moves in USD/CHF. Between Feb. 24, 2004 and March 9, 2004, the one-month volatility spiked above the threemonth volatility, which coincided with a period of range trading.
All shapes and sizes
Volatility is expressed many ways — on different time frames and in term of option prices and past price fluctuations in an underlying market.
Understanding some simple volatility principles, such as mean reversion, can help you time trades when a volatility shift is likely to occur.

Trend Finder Daily Trading System

put this indicator in indicator folder here C:\Program Files\MetaTrader\experts\indicators
StochHistogram.mq4
Put this tpl file in the "templates folder" here C:\Program Files\MetaTrader\ templates
trend finder daily.tpl
Chart Setup:
Open a Daily Chart.
Add the trend finder daily Template to the chart.
Add a 200 Simple Moving Average.
Buy Signal:
1. Price is above the 200sma.
2. The Awesome Oscillator has changed to green.
3. The Stochastic Histogram has changed to green.
Sell Signal:
1. Price is Below the 200sma.
2. The Awesome Oscillator has changed to red.
3. The Stochastic Histogram has changed to red.
Money Management and Exit Strategy:
1. Open 2 trades which together risk no more than 3% of your total available balance.
2. Set a stop loss of -100 pips for both trades.
Trade 1: Set a take profit at +50 pips.
Trade 2: Set a take profit at +100 pips.
When you reach +50 pips, set the stop loss for the remaining trade to break even.
Time frame
- All Time frames
Currency pair
- All pairs
any Question about the system i am here to answer

The Big Ben strategy

Big Ben is a currency-specific trading strategy designed to capture the first directional intraday move that often occurs within the first few hours after the Frankfurt/London market openings, which begin at approximately 1 a.m. ET. The strategy works best with the British pound/U.S. dollar (GBP/USD) rate.

Because this currency rate trades lightly outside of London trading hours, the surge in trading every morning in the U.K. gives it a “real” market opening, which the strategy looks to exploit. Figure 1 shows pound/dollar trading is virtually nonexistent during Asian trading hours. When London opens, however, the pound/dollar accounts for nearly one-quarter of all forex trading. Currency rates with more continuous, 24-hour trading will have less of a distinct open/close as they pass through the different money centers.
For example, the dollar/yen rate (USD/JPY), which dominates forex activity during Asian trading hours (78 percent of volume), still accounts for 17 percent of trading during European hours.
Before explaining the specific logic behind the methodology, let’s take a look at what needs to occur for a trade to set up.
The rules
The following rules are for short trades, but the strategy can be reversed to trade on the long side.
Setup:
1. The pair makes a new range low at least 25 pips (a pip is the forex equivalent of a tick, or minimum price fluctuation) below the opening price after the early Frankfurt/London trading in the GBP/USD rate begins around 1 a.m. ET.
2. The pair then reverses and trades 25 pips or more above the opening price.
3. The pair then reverses once again to trade back below the intraday low established in step 1.
4. Sell a breakout (at least seven pips) below the London low.
5. Once filled, place an initial protective stop no more than 40 pips above the entry price.
6. After the market moves lower by the distance between the entry price and the stop, cover half the position and trail a stop on the remainder.
These simple rules position you to profit from common behavior that can occur in the pound/dollar when the London/European market opens.
The logic
As mentioned, the pound/dollar rate tends to have lower trading volume outside European/London trading hours because the majority of GBP/USD spot deals are worked through U.K. and European dealers. This gives the European/British interbank community tremendous insight into the currency pair’s actual supply-demand picture.
The Big Ben trade sets up when interbank dealing desks use this intelligence to trigger stops on both sides of the market, resulting in new intraday highs and lows. Once these orders are cleared from the books, the market is primed for its first real directional move of the day, which is what the strategy is designed to capture.
The logic behind this trade should be familiar to S&P futures traders, as it is similar to many opening-range breakout strategies used to capitalize on the first real move of the day after the cash stock market opens in New York.
Trade examples

Figure 1 shows a prototypical Big Ben trade on a five-minute chart. The first vertical line marks midnight ET. The second vertical line denotes the Frankfurt open and the third line shows when London players begin entering the market.
When the Frankfurt market opened, the pound/dollar first moved lower, taking out any nearby sell stops. Within 15 minutes of London entering the picture, however, the market reversed to the upside. The pair was now free to make the first real directional move of the day, and it fell 90 “pips” before buyers stepped in.

Figure 2 illustrates a variation of the Big Ben strategy that commonly occurs when there is an abnormally wide opening range. In this case, the pound traded up 26 pips after the London open to 1.8583, establishing the top of its range. It then came under pressure and sold off 65 pips to make a low of 1.8518 (horizontal line). Next, the currency traded up 50 pips before reversing and plunging below the former low. In this case, a trader could still justify entering a position, since the basic principles behind the trade were still present.
The Big Ben currency day-trading strategy allows you to limit initial risk and capture good moves early in the London trading session. The product of years of watching the currency markets, the approach is based on the workings of the global forex market and attempts to exploit its structure.

Pivot Points and Candlesticks Trading Strategy

Augmenting pivot point analysis with candlestick formations helps determine potential turning points in the forex market.

BY JOHN PERSON

Trade setups confirmed by independent techniques or tools — or those that occur simultaneously on different time frames — naturally carry more weight than those signaled by a single input. The trade examples outlined here combine pivot points with candlestick patterns to better pinpoint forex trade opportunities.

Pivot point analysis is based on mathematical calculations used to determine future support and resistance levels. The pivot point value is derived from the high, low and closing prices of the previous price bar, and is then added to and subtracted from the previous bar’s reference points to determine support and resistance levels for future trading. The pivot point (PP) formula is:
1. PP = (H + L + C)/3
2. First resistance level (R1) = (PP*2) - L
3. Second resistance level (R2) = PP + (H - L)
4. First support level (S1) = (PP*2) - H
5. Second support level (S2) = PP - (H - L)
There is some debate about which value should be used for the closing price in the virtually 24-hour forex market. In forex, all trades must be settled within two business days, which is established at the close of banking business at 5 p.m. ET. As a result, this is the time typically used for the closing price.
Using pivot points
Some traders use the pivot numbers to estimate the upcoming high or low, or to simply identify a level at which a market might change direction on an intraday basis.
A popular pivot-point approach is to cover any short positions and go long at either of the two support levels, or sell any long positions and go short at the projected resistance levels. Accordingly, while these price levels provide points at which to enter or exit the market, they also indicate where not to make trades. For example, you should not buy just below either of the resistance levels.
It is beneficial to use multiple time frames — e.g., monthly, weekly, and daily — to identify multiple pivot point support and resistance levels. A particular level has more significance when pivot points on two or more time frames coincide.
Combing pivot point levels with the price moves implied by candlestick patterns improves your odds of identifying favorable trade points.
Candlesticks
The components of a candlestick are derived from the same open, high, low, and close data that make up standard bar charts. The main component we are concerned with here is the relationship between the open and close of a session, which is called the candle’s “body” or “real body.” The color of a candlestick does not indicate whether it closed higher or lower than the preceding candle; rather, it reflects where the candle closed relative to the open.
In Figure 1, the trading period’s high and low are represented by the highest and lowest points of the candlestick, while the session’s open and close are represented by the top and bottom of the wider part of the candlestick. The thin lines at the tops and bottoms are called “shadows” (or wicks), and the wider parts are the real bodies. The candle is typically white (or hollow, or green) if the close was above the open and black (or red) if the close was below the open. Candle A closed higher than the open and candle B closed below the open. Candle C closed above the open — the open was the low price of the day, and the close was the high price of the day. Candle D illustrates the opposite condition. Finally, candle E opened and closed at the same price and is identical to its bar-chart equivalent.
Doji-based patterns: Indecision and reversal
Candlesticks are designed to make bullish and bearish momentum more evident on a price chart. This can highlight certain patterns, such as the high-close doji, that help determine a change in market direction or reversal.
A doji is a candle that opens and closes at (or very near) the same price — look again at Candle E in Figure 1. Such candles indicate indecision or uncertainty. Both buyers and sellers have lost confidence from the time the market opens, as price has pushed both higher and lower, only to end up where it started. Indecision is the last thing you want to see in a trending market. Rejection or failure from a high or low is a sign potential changes in the market are on the horizon.
In a strong downtrend, a market will usually close near its low as highly-capitalized traders hold or add to short positions overnight. If these bigmoney traders are not confident the market will close lower, the market may have the tendency to close back near the open.
Dojis sometimes appear as part of more reliable two- and three-candle formations, such as the morning star pattern, that highlight reversals. The basic morning star is a three-candle, bottom reversal pattern. When the pattern’s middle candle is a doji, it is called a morning doji star, as shown in Figure 2.
The first candle has a long, black real body (a lower close than open); the second candle has a small body that gaps below the first candle’s body. The third candle is a white candle (a higher close than open), and closes above the midpoint of the first candle’s real body. The third candle’s body may sometimes gap higher than the second candle’s body, as is the case in Figure 2.
There are several variations to this textbook description. For example, the initial black candle might have a small real body and the real body of the long white candle might entirely engulf the long dark candle or simply just partially penetrate its real body. The most important thing to notice is what happens after the doji candle. A candle after a doji that closes above the doji’s high confirms a directional change has occurred.
When either a morning doji star or simply a doji develops after a downtrend — especially if it is near an important target, such as a pivot point support level — it is likely if the next candle closes above the doji’s high, a reversal of the recent trend will occur. To trigger an entry, it is important for price to close above the doji’s high. This confirms the breakout and positive momentum should develop within a few bars.

Trade examples: Combining pivots and dojis
Lining up the pivot points on your screen before the beginning of a trading session prepares you for when a setup like a doji or morning doji star pattern develops.
Figure 3 is a 15-minute chart of the Euro/U.S. dollar rate (EUR/USD). On Dec. 10 (a Friday) the high was 1.3318, the low was 1.3148, and the close was 1.3241. The resulting pivot point levels for the following trading day (Dec. 13) are:

Pivot Point = 1.3236
R2 = 1.3406
R1 = 1.3323
S1 = 1.3153
S2 = 1.3066

On Dec. 13 the high turned out to be 1.3325, the low was 1.3192, and the close was 1.3313. The market did not precisely hit the S1 target number, but the low occurred almost exactly at the midpoint (1.3194) of the pivot point (1.3236) and S1 (1.3153). In a bullish market, the market will often hold between the S1 and the pivot point. It is at this price level you should look for setups such as the doji.

Figure 4 is a five-minute chart of the December 2004 EuroFx futures contract (ECZ04) from Nov. 16. Note that once the candle closes above the second doji candle’s high (see the green arrows), price has clearly changed direction.
This chart also provides a good example of how the market reacts near pivot point levels. On the previous day (Nov. 15), the high was 1.2999, the low was 1.2916, and the close was 1.2943. The pivot point was 1.2953 and the support and resistance levels were: R1 = 1.2989; R2 = 1.3036; S1 = 1.2906; and S2 = 1.2870. The high on Nov. 16 was 1.2996, the low was 1.2920, and the market closed at 1.2966.
There were two opportunities to trade from the long side using the doji method. The first doji, which made the low of the day (the first green arrow), was a morning doji star pattern. It formed below the daily pivot point. Notice that once the market closed above the doji’s high it triggered a long position. This up move stalled around the R1 level at 1.2989. (Also notice a doji appeared immediately after the high, and the market proceeded to trade lower.)
Trade management
A risk-control strategy to accompany this pattern might include placing a stop-loss order below the doji’s low by an amount that is 120 percent of the 10-day average range. You could also use a stop-close-only order (which is triggered only on the market close) below the doji’s low for the time period you are trading in.
All time frames
This method is applicable to both the forex market and currency futures, as well as different time frames. (The five-, 15-, 30-, and 60-minute time periods are especially useful in forex trading.) The confluence of trading signals can help identify points at which a market is likely correct or reverse, which is useful for entering trades as well as taking profits.

Pbar Swing System

The system developer is Zunit. Here is the system thread in ForexFactory forum.
put this indicator in indicator folder here C:\Program Files\MetaTrader\experts\indicators
Pbar_ Indicator.mq4
Put this tpl file in the "templates folder" here C:\Program Files\MetaTrader\ templates
pbar_Template.tpl
Buy Signal:
1- RSI 2 period goes above the 50 level.
2- ADX 1 period is below the ADX 16 level.
Sell Signal:
1- RSI 2 period penetrate the 50 RSI level.
2- ADX 1 period goes above the 16 ADX level
Stop Lose
- 80 pips or the lowest low of the previous 3 bars.
Target profit
- Exit when the stochastic crosses.
Time frame
- All Time frames
Currency pair
- All pairs ( EUR/CHF Recommended )
any Question about the system i am here to answer
HAve A nICe tRADe

Narrowing breakout channels

System concept

Many trend-following systems use breakout channels that track high and low levels over certain look-back periods (e.g., 20 days) to determine trends. Once price crosses above or below the channel price, these systems enter the market in the breakout direction. However, because many trend followers enter the market when price exceeds these levels, it’s difficult to get a good fill.
This system narrows the breakout channel a bit to place trades before other traders do. Instead of waiting for price to cross its highest or lowest points over the last 20 days, this system enters at the second highest or lowest level. The system uses two indicators called HighestN and LowestN that return the nth highest or lowest price within any look-back period (these indicators are available free at www.Wealth-Lab.com).
Figure 1 shows several trade signals in the Euro FX futures (EC). The system held a short position on May 26, 2000 before reversing and going long once price crossed above the upper boundary of the second highest channel. Then, it exited and went short on July 13 after price crossed below its lower band — a 1.3- point gain.
The system held this short trade until Nov. 30, when it reversed again as price penetrated the upper channel — a 7-point profit. This final long trade exited on Jan. 24 with a 5.2-point profit. Each trade occurred slightly earlier and was more profitable than a standard breakout system based on 20-day highs and lows.
Rules:
1. Go long at stop at the second highest high of the last 20 days.
2. Exit long and go short at stop at the second lowest low of the last 20 days.
Test data
The system was tested on the following currency futures: British pound (BP), Euro FX (EC), Japanese yen (JY), Swiss franc (SF). This test used ratio-adjusted data from Pinnacle Data Corp. (www.pinnacledata.com).
Test period
January 1990 until January 2005.
Starting equity
Starting equity is $1,000,000. Deduct $20 commission per round-trip trade per contract. Apply two ticks of slippage per stop order.
Money management
Risk a maximum of three percent of current account equity per trade. The number of contracts per position is calculated using the basis price (the closing price of the entry bar), the stop-loss level, the contract’s point value (i.e., the dollar value of a one-point move), and the portfolio’s total equity.
For example, the S&P futures contract has a point value of $250. Assume the system goes long at 1,000 (the basis price) and the stop-loss is 900. To determine the trade’s dollar risk, multiply the point value ($250) by the difference between the basis price and the risk-stop (1,000 - 900 = 100). Therefore, a single contract’s dollar risk is $25,000.
If the portfolio’s total equity before entering the position was $1,000,000 and we do not want to risk more than 10 percent of our total equity ($100,000), we would buy four contracts.
Had total equity been less than $250,000, we would not have been able to take this position because its dollar risk would exceed our system’s 10-percent equity risk. This position-sizing method keeps us out of risky trades that have potential to ruin our account.

Test results
Figure 2’s equity curve increased steadily during the first five years. But the test’s second half was quite volatile, with high equity peaks and drawdowns of up to 48 percent — too high for most traders. Figure 3’s drawdown curve confirms this behavior. The system’s high volatility also resulted in a low Sharpe ratio (0.58).
However, its 10-year annualized gain was almost 12 percent. Also, the system’s exposure (8.55 percent) is very low — see Figure 2’s light green area. With such low exposure, you could increase your risk or invest the remaining capital somewhere else to flatten the equity curve.
We also tested the system across a wide range of parameters and compared the results to the traditional breakout system (i.e., highest high and lowest low). We ran separate tests with look-back periods from 10 to 60 days, and we also tested different parameters (n = 1, 2, and 3). All other variables (position sizing, commission, slippage, etc.) remained constant.
Figure 4 compares the different tests’ profitability. Note that all tests began on the 60th day so all results could be compared to each other. Thus, profits for the 20-day lookback period differ somewhat from the original results.
The figure shows the second highest/lowest levels (blue bars) outperformed the traditional break-out approach (yellow bars) for all periods except the 40-day window. Also, the third highest/lowest channel (red bars) boosted gains even further in eight of 11 cases.

Outcome
When waiting for a breakout signal, it makes sense to use a modified channel based on the second (or even third) highest/lowest price. While Figure 4 proved these narrower high/low levels can lead to higher profits, we only tested parameters from 1 to 3. Testing larger values (n = 4 or higher) would show whether results could be improved further. But don’t forget to also test the system across many look-back periods to ensure its stability.

—José Cruset of Wealth-Lab
January 2006 • CURRENCY TRADER

Hedging Lots Strategy

1. Just for simple explanation i assume that there is no spread. Take position with any directions we like, example: Buy 0.1 lot at 1.2160. At the same time or a few seconds after placing Buy, put Stop Sell 0.3 lot at 1.2130. Attentions the Lots.

2. If the TP at 1.2190 not reached and the price goes down and reach SL or TP at 1.2100 then we have profit 30 pips because Stop Sell has become an active Sell before.
3. But if TP and SL at 1.2100 not reached and the price goes up again, we have to had Stop Buy already at 1.2160 to anticipate. At the time Stop Sell was reached and became active Sell 0.3 lot (pic: number 2), we have to immediately place the Stop Buy 0.6 lot at 1.2160 (pic: number 3).
4. If the price goes up and reach SL or TP at 1.2190, then we have profit 30 pips too.
5. If the price goes down again without reaching any TP, then continue anticipating with Stop Sell 1.2 lot, then Stop Buy 2.4 lot,…and next. Continue this sequence until we meet the profit. Lots : 0.1, 0.3, 0.6, 1.2, 2.4, 4.8, 9.6, 19.2, 38.4 and 76.8.
6. At this example i use 30;60;30 configuration (TP 30 pips, SL 60 pips and Hedging Distant 30 pips). Otherwise we can try use 15;30;15, 60;120;60. Also we can try to maximizing profit by testing 30;60;15 or 60;120;30 configurations.
7. Considering the spread, choose the pair are most tightest spread like Euro/Usd. Usually the spread is only around 2 – 3 pips. More tight the spread, more absolute the winning we got. And I think I found the “Never Loss Strategy”…let the price move to anywhere he likes, we’ll get the profit anyway.
Harry
Download
Paulo_Costa_Hedge.mq4
Paulo_Costa_Hedge.ex4

Euro Dollar one-minute Trading System

The System rules :-
Indicators:
Step MA v7 - default with step set to 20 & width set to 1
Heiken Ashi - default with color set to red/dodger blue & width set to 1
Stochastic Oscillator - set to 14,3,3 with 20/80 levels & only using the main line
Strategy MT4 Template stepma.tp

Buy Signal
1- the step ma turns from red to blue
2- stoch signal line closes at or above the 80 level
3- heiken ashi candle is blue
Sell Signal
1- step ma turns from blue to red
2- stoch signal line closes at or below the 20 level
3- heiken ashi candle is red
Stop Lose
20 pips including spread
Target profit
20 pips after spread
Time frame
1 minute
Currency pair
EUR/USD
Trade signal
On the close of a candle
any Question about the system i am here to answer
HAve A nICe tRADe